What a grade tells you,
on one real company.
No feature tour. Just the one thing GMI does — grade a company from its own numbers — done in front of you on Apple, step by step. Then you pick a company you know and we grade that one.
One letter, A+ down to F.
Every stock gets a single letter so you can compare companies at a glance. Behind it sits a score out of 100. Apple's is 93, which is an A+.
The grade describes the company's financials as they stand. It is not a forecast of the share price and not a tip — a strong company can still be an expensive stock.
Start at 50. Six factors add or take away points.
Every number comes from the company's own financial statements, plus one from Wall Street's analysts. The bands are published in full — nothing is weighted behind your back.
| Factor | In plain English | Apple | Points |
|---|---|---|---|
| Revenue growth | Are sales growing? | +6.4% | +10 |
| Profit growth | Is profit growing? | +19.5% | +10 |
| Debt-to-equity | How much it owes per dollar its owners put in | 1.52 | +5 |
| Return on equity | Profit made per dollar its owners put in | 151.9% | +15 |
| Current ratio | Can this year's assets cover this year's bills? | 0.89 | 0 |
| Analyst price target | Where analysts' average target sits vs. the price | +5.5% | +3 |
| 50 + 10 + 10 + 5 + 15 + 0 + 3 | 93 → A+ | ||
The full arithmetic, with every band: How the grade works.
An A+ still has a zero in it.
Apple's current ratio is 0.89: this year's assets don't quite cover this year's bills. That earns zero points, not a pass — the grade doesn't grade on reputation.
Low marks work the same way everywhere. Take debt: a company that owes less than half of what its owners have put in earns +15; one that owes more than five times that loses 10. That is what an F on debt means, and it is how a company can grow its sales and still grade poorly.
The grade is the headline. The report is the story.
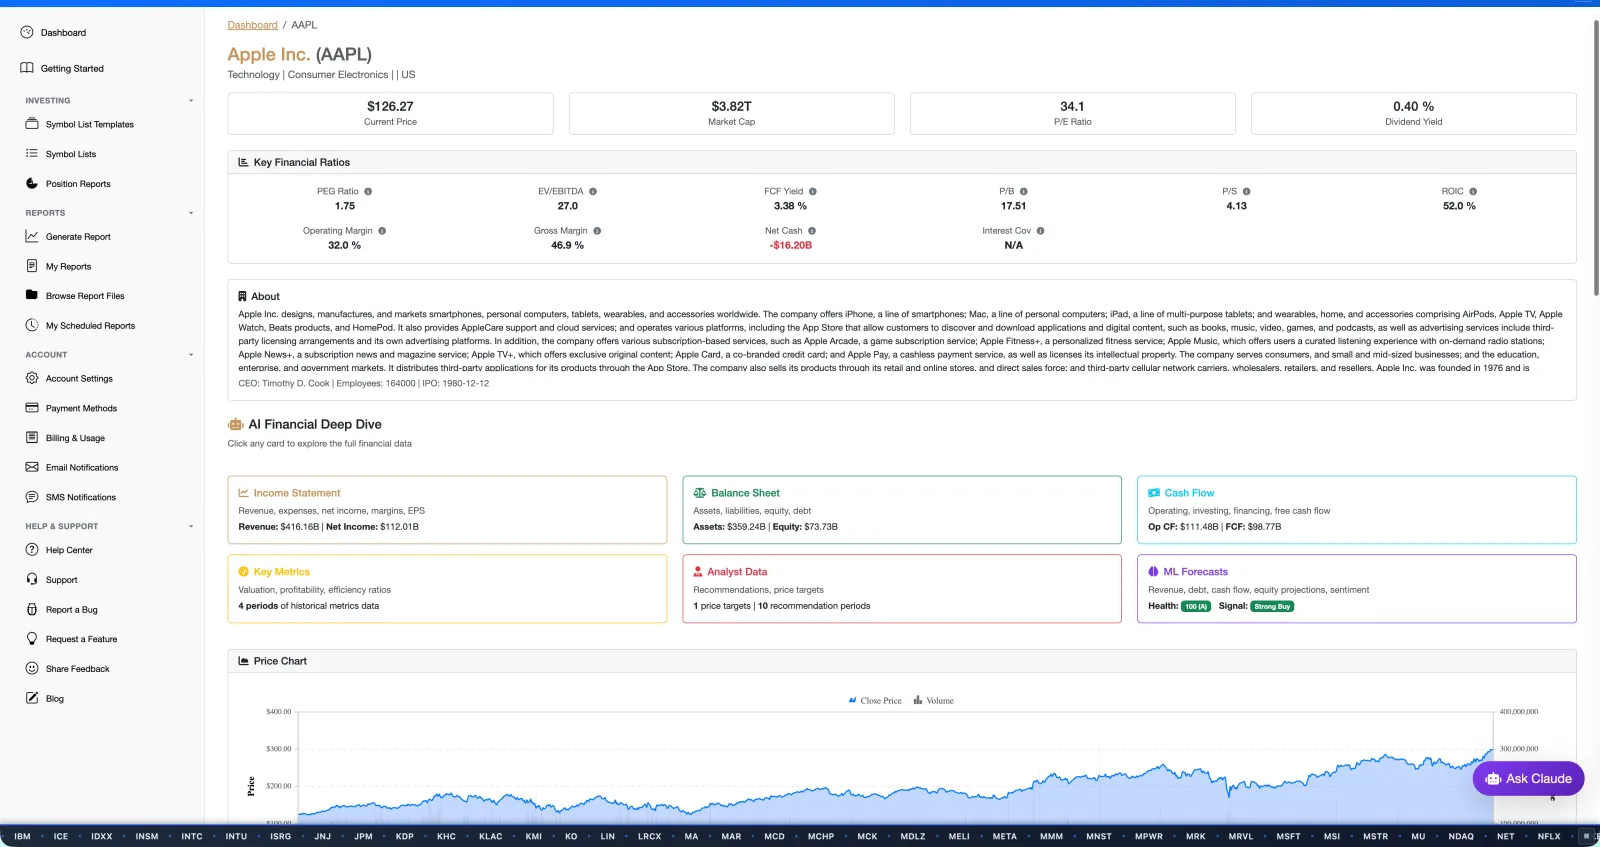
A report puts every number behind the grade on one page — five years of statements, the grade's history, machine-learning forecasts, news, and a plain-English read of each chart. This is Apple's.
Pick a company you know.
Sign in free and we'll build its full report — you'll see the grade, the numbers behind it, and what they mean. No ticker symbols to look up, no credit card.
Grade My Investments is not a registered investment advisor. Grades and reports are for informational and educational purposes only — not financial advice. The Apple figures are a dated snapshot for illustration. Full Terms.