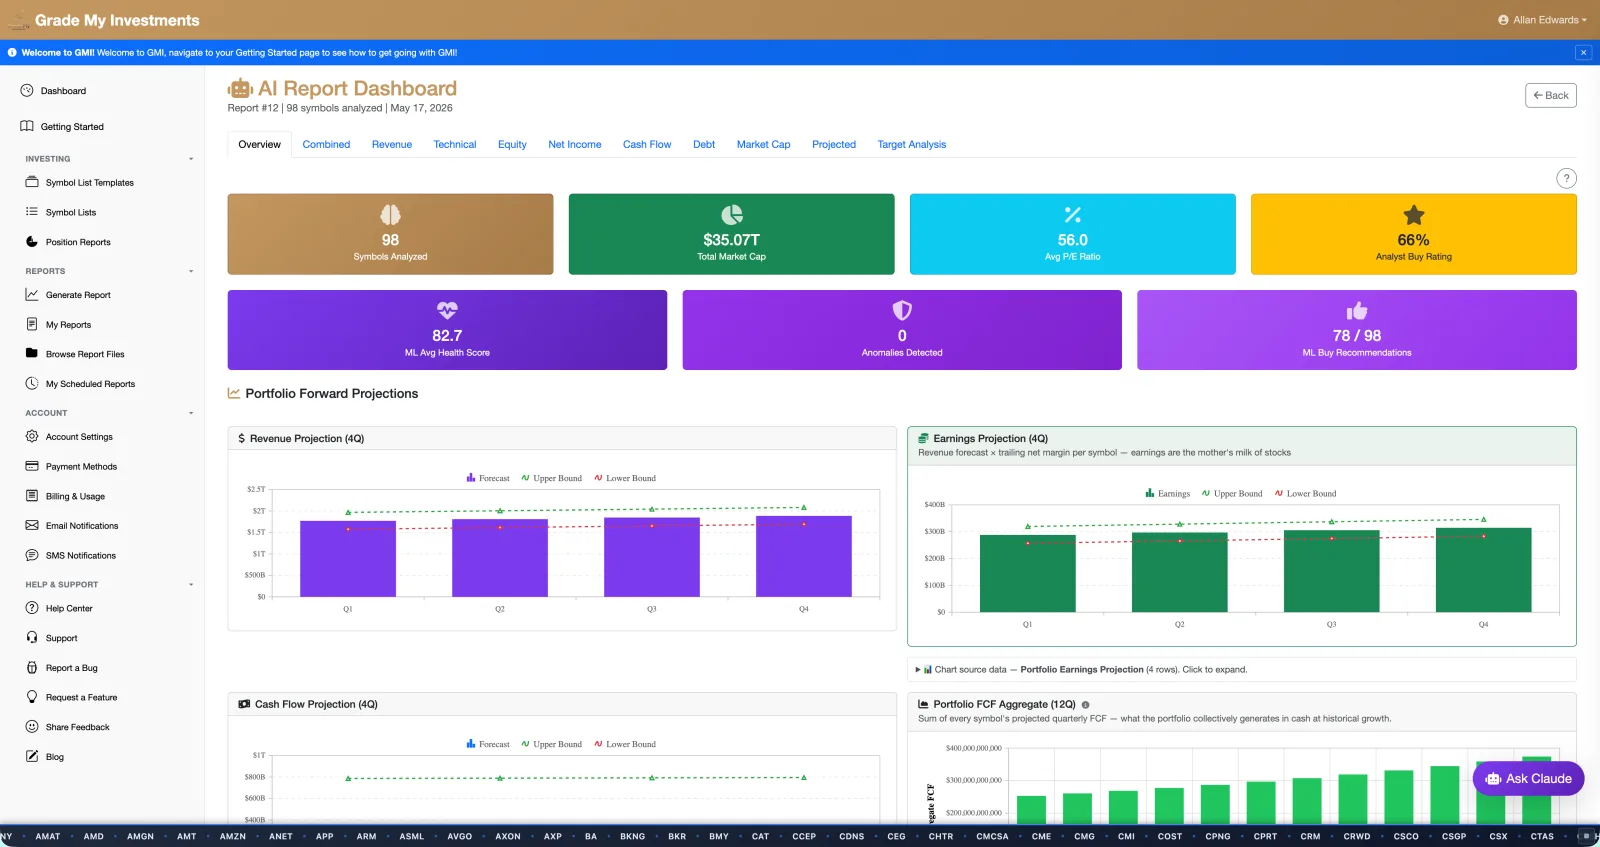
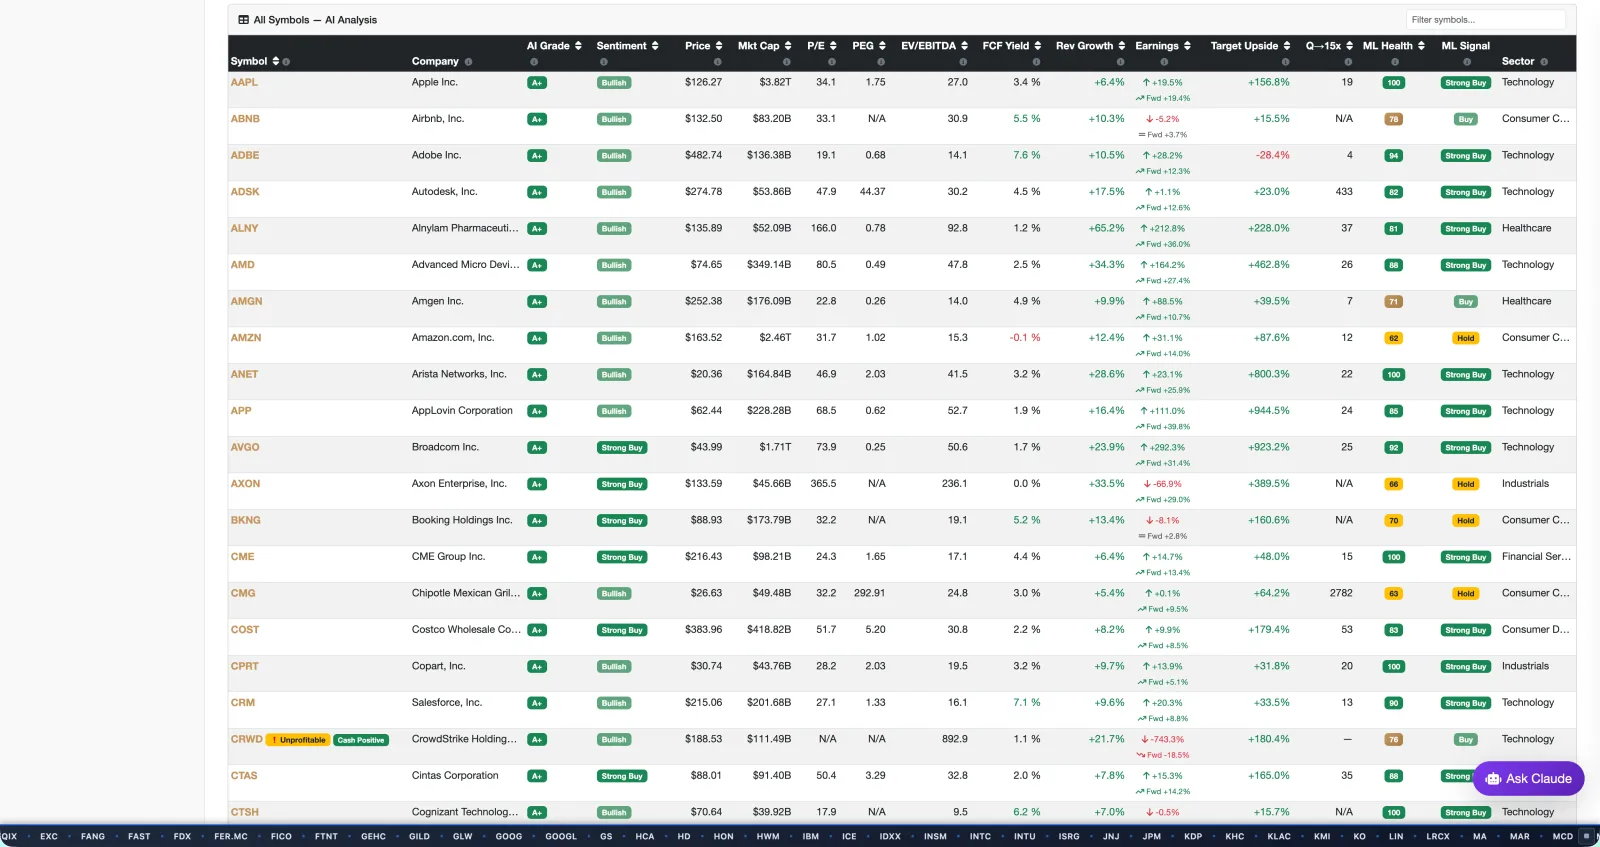
Find the D's and F's in your portfolio.
Run your watchlist or a portfolio export. Sort the resulting dashboard by grade and immediately see which holdings are deteriorating — before the next earnings call surprises you.
Track eight stocks free, for life — live letter grades and one AI report a month. See which holdings are deteriorating before they hit your statement. No subscription. How the grade works.
NEW Don't just grade your stocks — grade the economy →
NO CREDIT CARD REQUIRED

Not features. Outcomes. Each one is what you'll have *finished* by the end of your first half-hour with GMI. Built for nine kinds of investor →
Run your watchlist or a portfolio export. Sort the resulting dashboard by grade and immediately see which holdings are deteriorating — before the next earnings call surprises you.
Run VOO, QQQ, or any fund. See the grade distribution across all 500 underlying stocks — and which names are pulling the average down. Most ETF investors have never seen this.
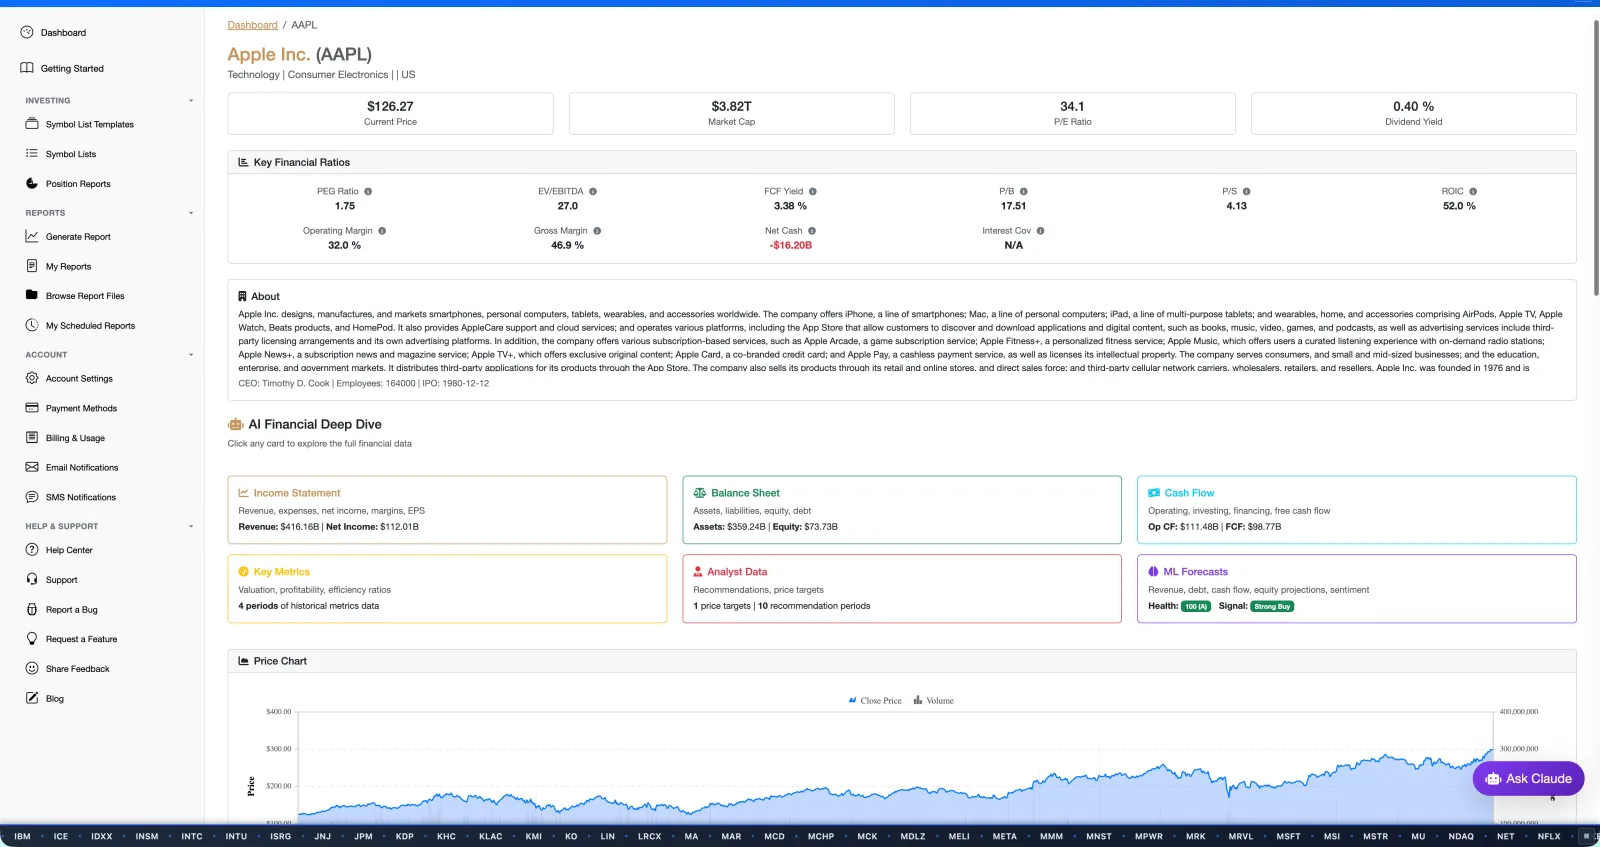
"Which five stocks have the strongest cash flow?" "Compare debt levels across my tech names." Claude reads your actual report data — no hallucinations, no generic essays.
Ran an analysis worth talking about? Every report has a Share button. Send the link to a friend, your investment club, or the group chat — they see the full graded summary, no account required. How report sharing works →
Hit Share on any report and get a private link you can paste anywhere. You stay in control — revoke it whenever you want and see how many people viewed it.
In iMessage, Slack, or WhatsApp your link unfurls into a rich preview card — portfolio grade, ticker grades, and key stats — before anyone even taps it.
Recipients get a fast read-only summary — grades, KPIs, AI insights — with no sign-up wall. If they want grades on their own stocks, the free tier is one click away.
Your stocks have grades. Now the water they swim in does too. The Macro Dashboard reads 38 official U.S. economic series and answers two questions in one glance: which of four economic seasons we're in, and how favorable conditions like these have historically been. Explore the Macro Dashboard →
Growth speeding up or slowing? Inflation heating or cooling? Two questions sort every month since 1997 into one of four regimes — and today's answer sits at the top of the dashboard, updated on the government's own release schedule.
The Macro Grade was tested against 29 years of history before launch — and the warts are printed on the label: where it warned early, where it ran late, and the one false alarm. The formula is frozen in public, never quietly retuned.
The Regime Playbook shows which sectors have historically been tailwinds or headwinds in seasons like this — sample sizes included. And in the Macro Lab, you can re-weight the formula yourself and watch 29 years of calls rebuild live.
AI made stock analysis a commodity.
Workflow is what you do with it.
Anyone can paste a ticker into ChatGPT. You'll get a brilliant essay. Try it on forty-seven stocks and you have forty-seven differently-framed essays that don't compare to each other and disappear when you close the tab.
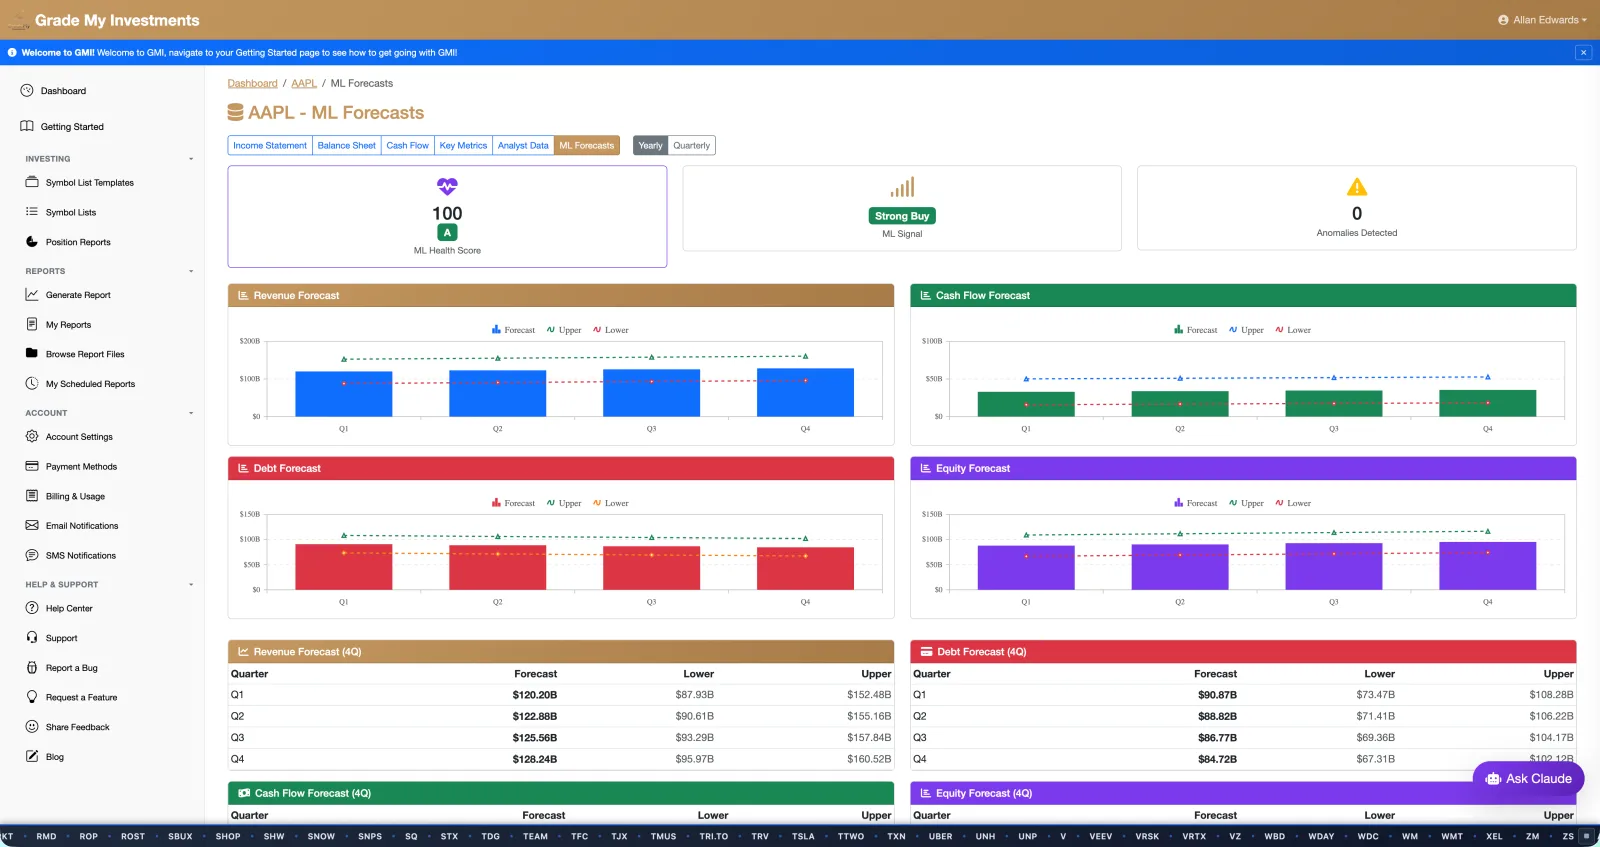
GMI applies the same methodology to every stock, every quarter, with a timeline you can audit — plus Claude built in for follow-up questions grounded in your real report data.
Compare that to $10–$50 a month for the major retail tools, or $24,000+/year for the institutional ones.
No credit card required. Sign in, verify your email, add your stocks — live grades and a monthly AI report, on us. Upgrade only if you want more.
Disclaimer: Grade My Investments is not a registered investment advisor and does not provide financial advice. All reports and AI-generated analytics are for informational and educational purposes only — not personalized recommendations. AI content may contain errors. Financial data may be delayed. Use at your own risk. Full Terms & Conditions.