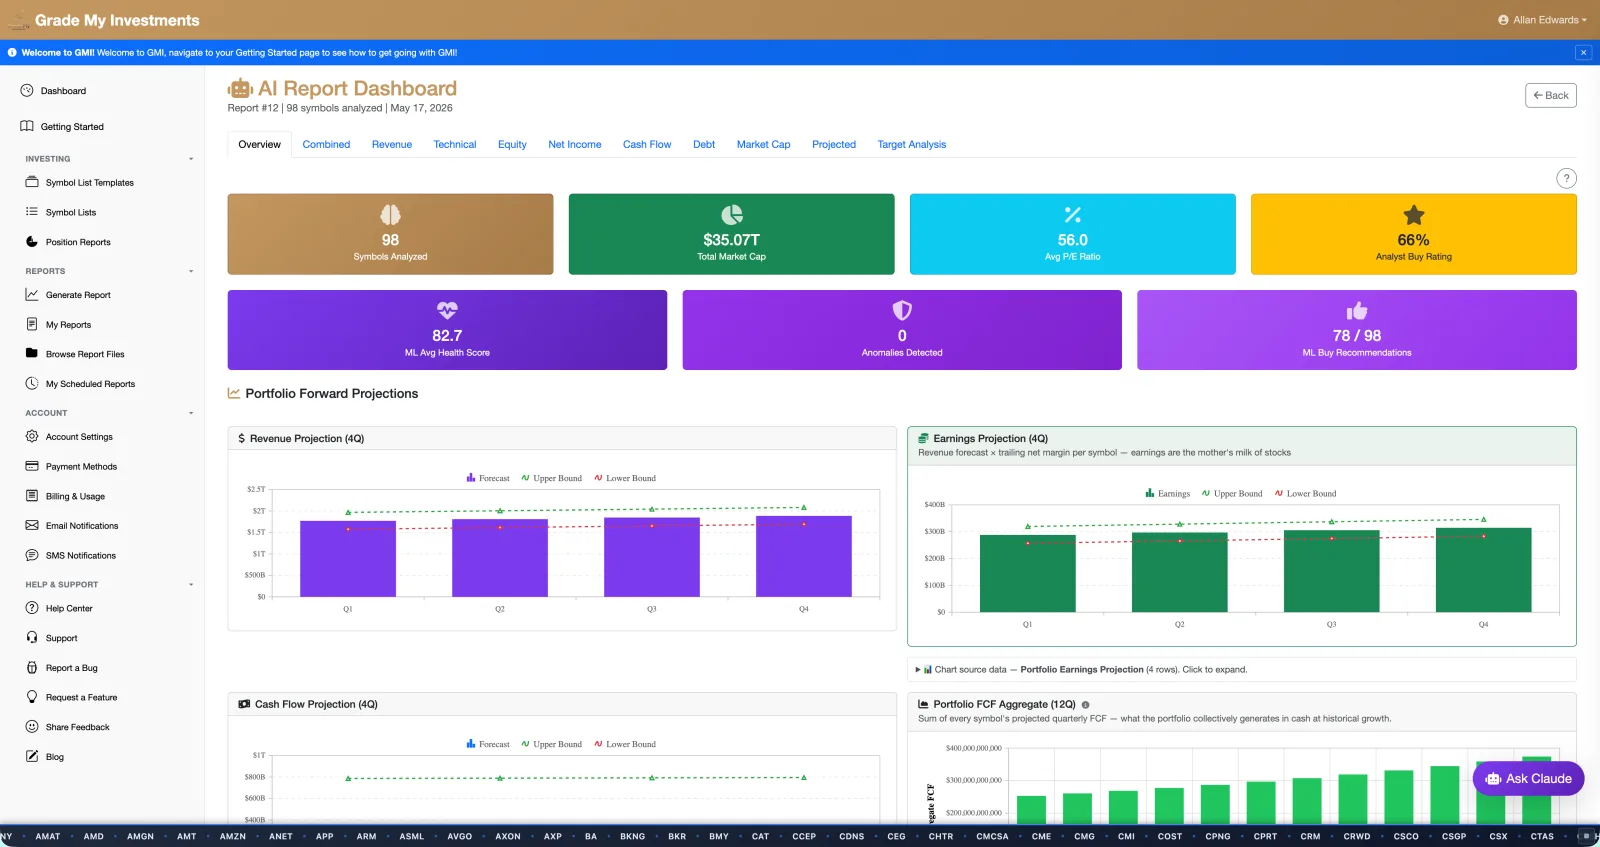
A live interactive dashboard.
Open the AI Report Dashboard in the browser. Summary KPIs at the top, every stock in a sortable table, click any name to drill into 20+ tabs of financial depth. Ask Claude a follow-up question without leaving the page.
Real reports. Real data. Two complete sample runs — a 98-symbol portfolio scan and the Magnificent 7 deep dive — generated by GMI in production, screenshots and downloadable files included. This is what shows up in your account when you run your first report.
Open the AI Report Dashboard in the browser. Summary KPIs at the top, every stock in a sortable table, click any name to drill into 20+ tabs of financial depth. Ask Claude a follow-up question without leaving the page.
The same data shipped as Excel workbooks, browser-ready HTML, and raw JSON. Download to your machine, open in Sheets, hand to your advisor, or feed into your own model. Right-click anything to send it through Claude.
Both are generated automatically on every report run — same data, different ways to use it.
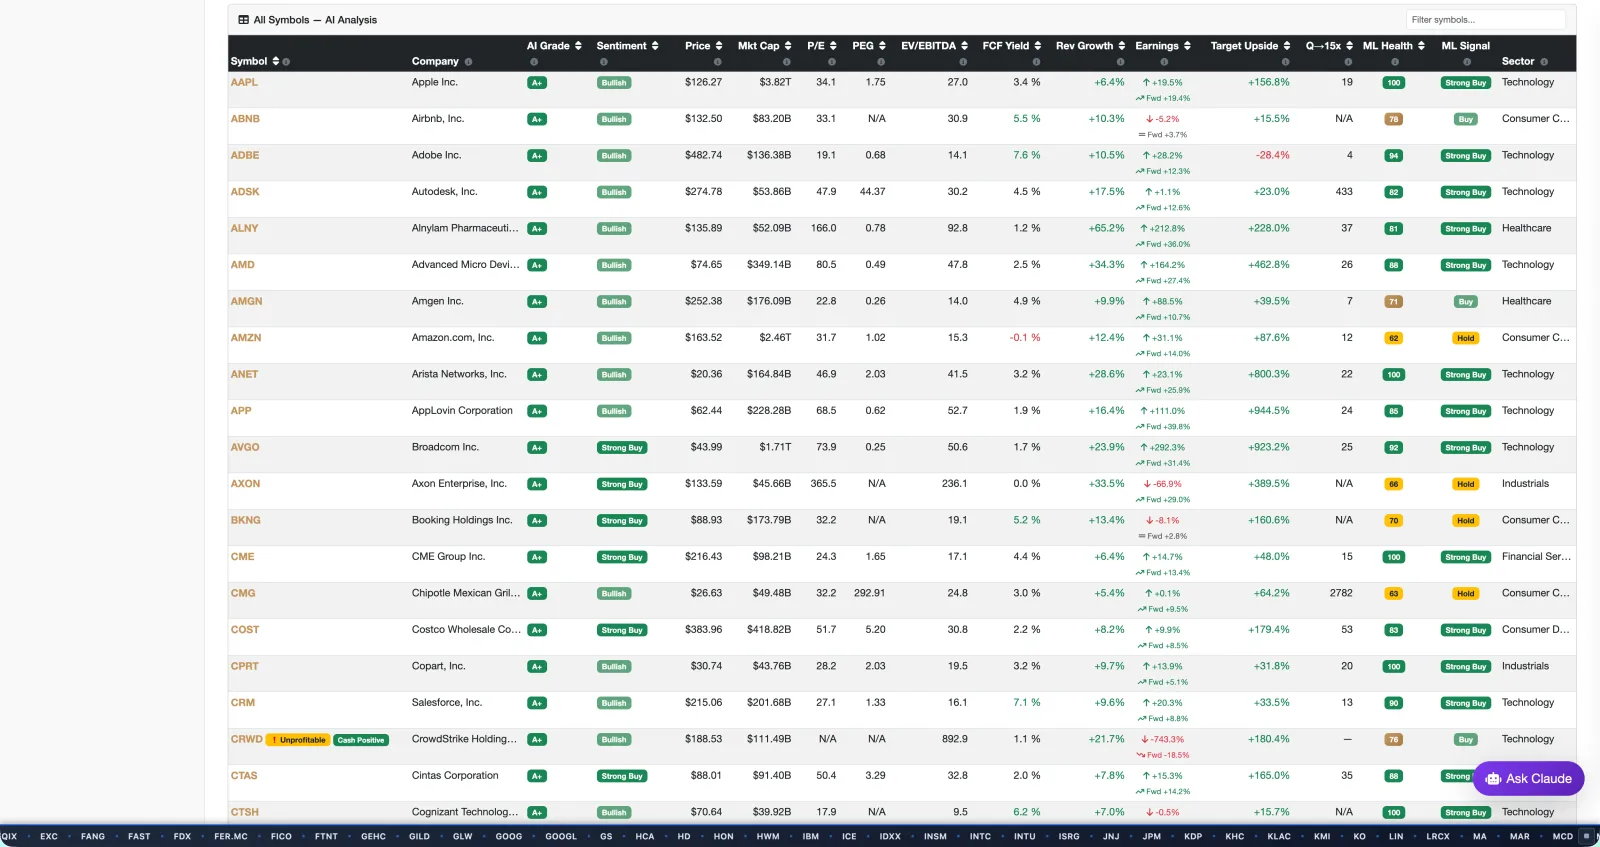
A 98-symbol portfolio analyzed in a single report. Below is the actual dashboard output — no mockups, no marketing renders.
Summary cards at the top: symbols, market cap, average P/E, ML health, anomaly detection, buy/sell counts. Below that, AI Insights & Alerts surface the top-rated stocks with the reasoning for each.

Every symbol in one sortable, filterable table: AI grade, sentiment, pricing, market cap, P/E, revenue growth, target upside, ML health, ML signal, sector. Click any column header to sort.

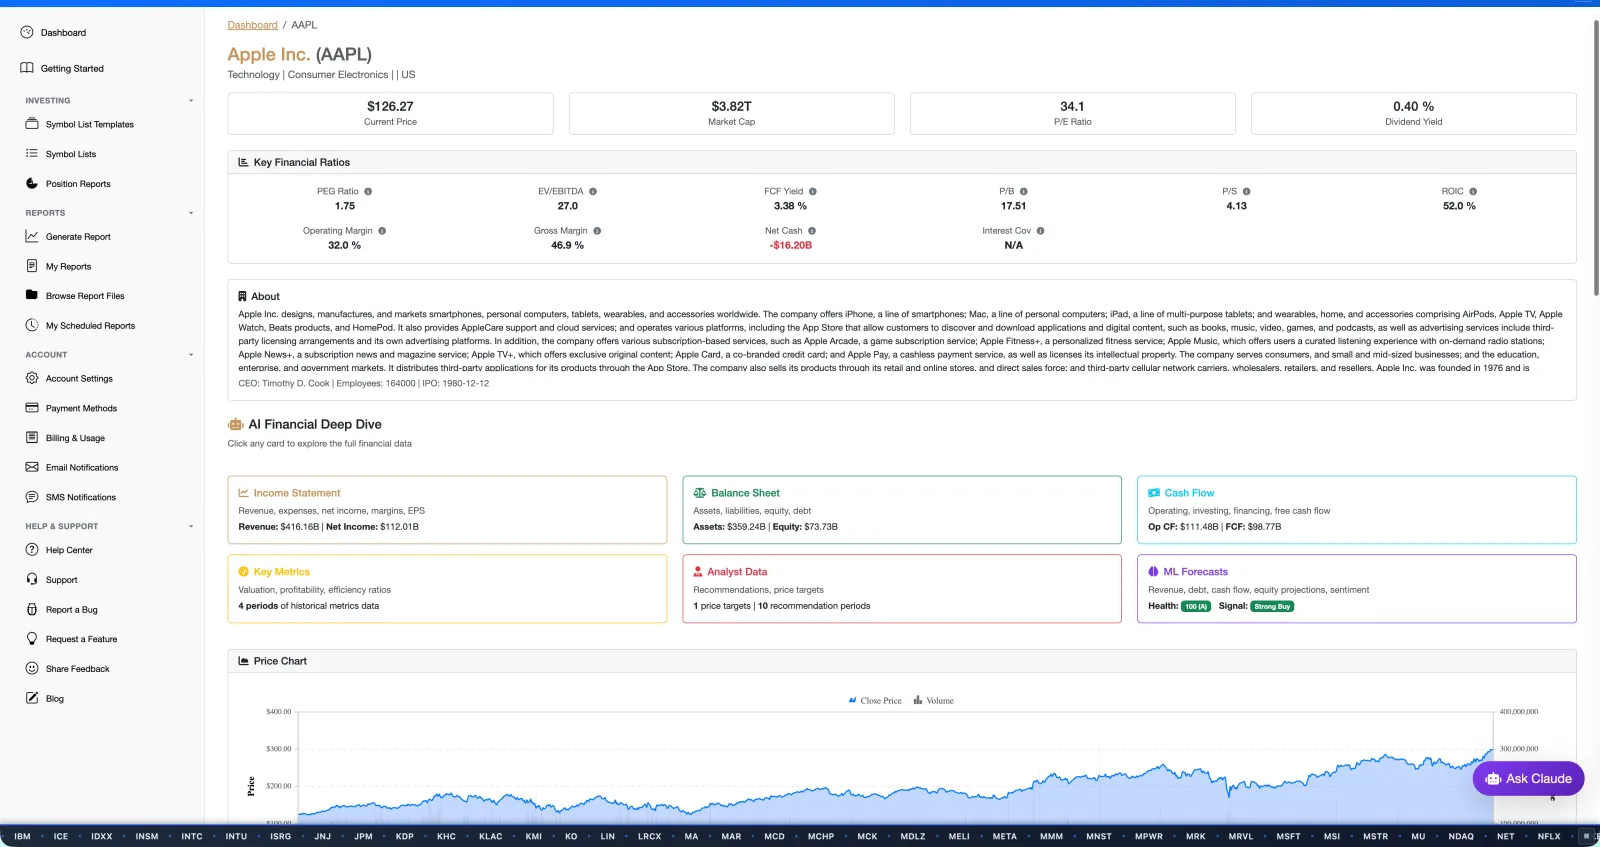
Click any symbol for the deep dive — pricing data, company overview, and interactive cards for Income Statement, Balance Sheet, Cash Flow, Key Metrics, Analyst Data, and ML Forecasts.

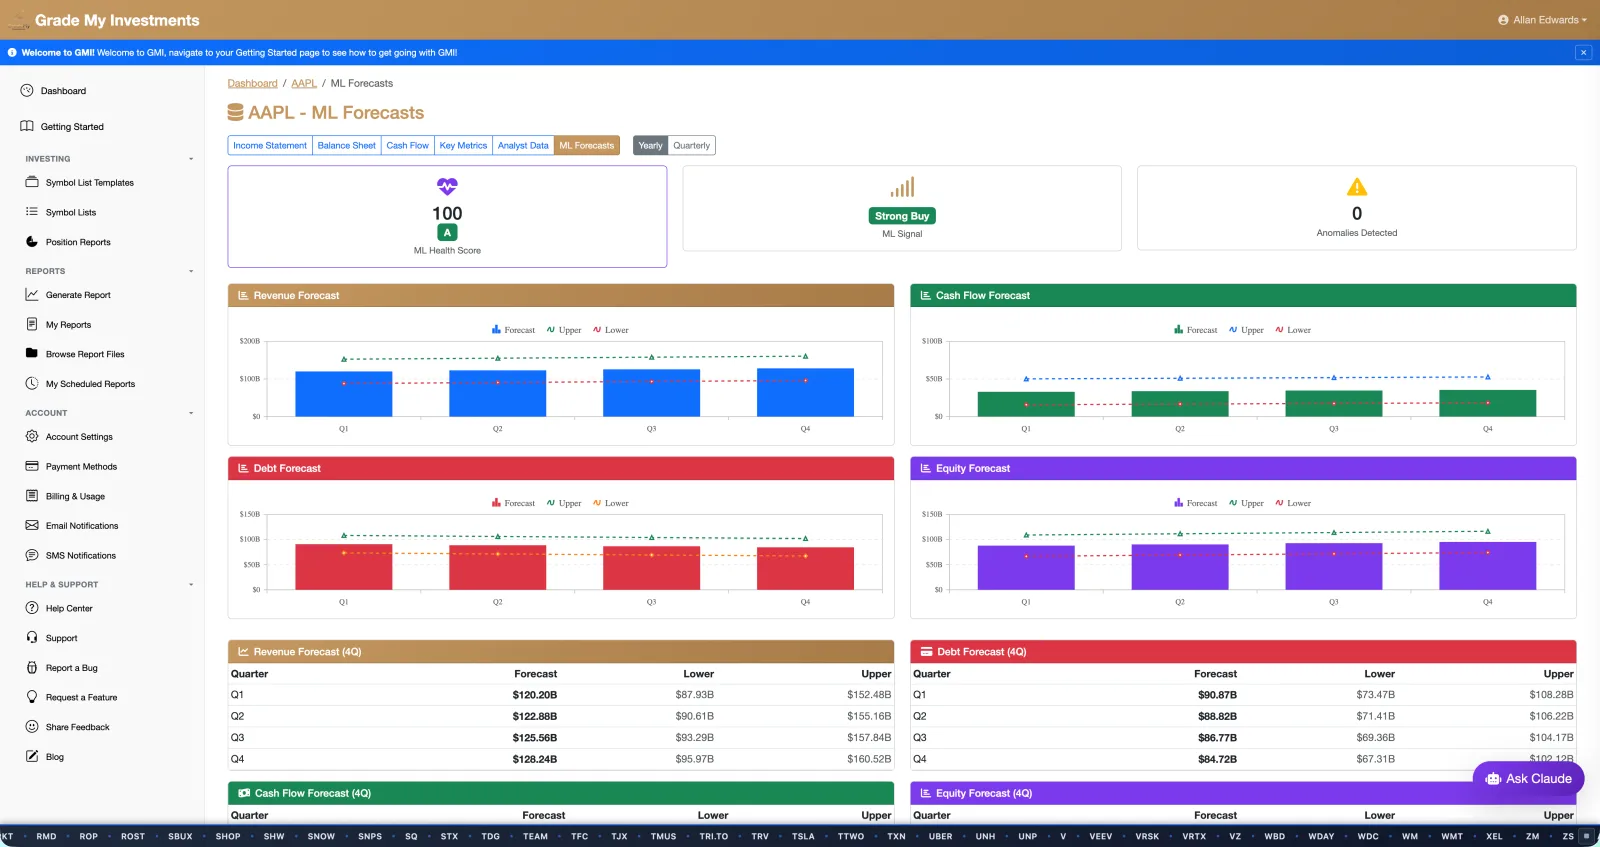
Four-quarter ML predictions for revenue, debt, cash flow, and equity — each with confidence intervals. Plus a 4-week sentiment forecast with intensity, confidence, risk rating, and the technical signals driving it.

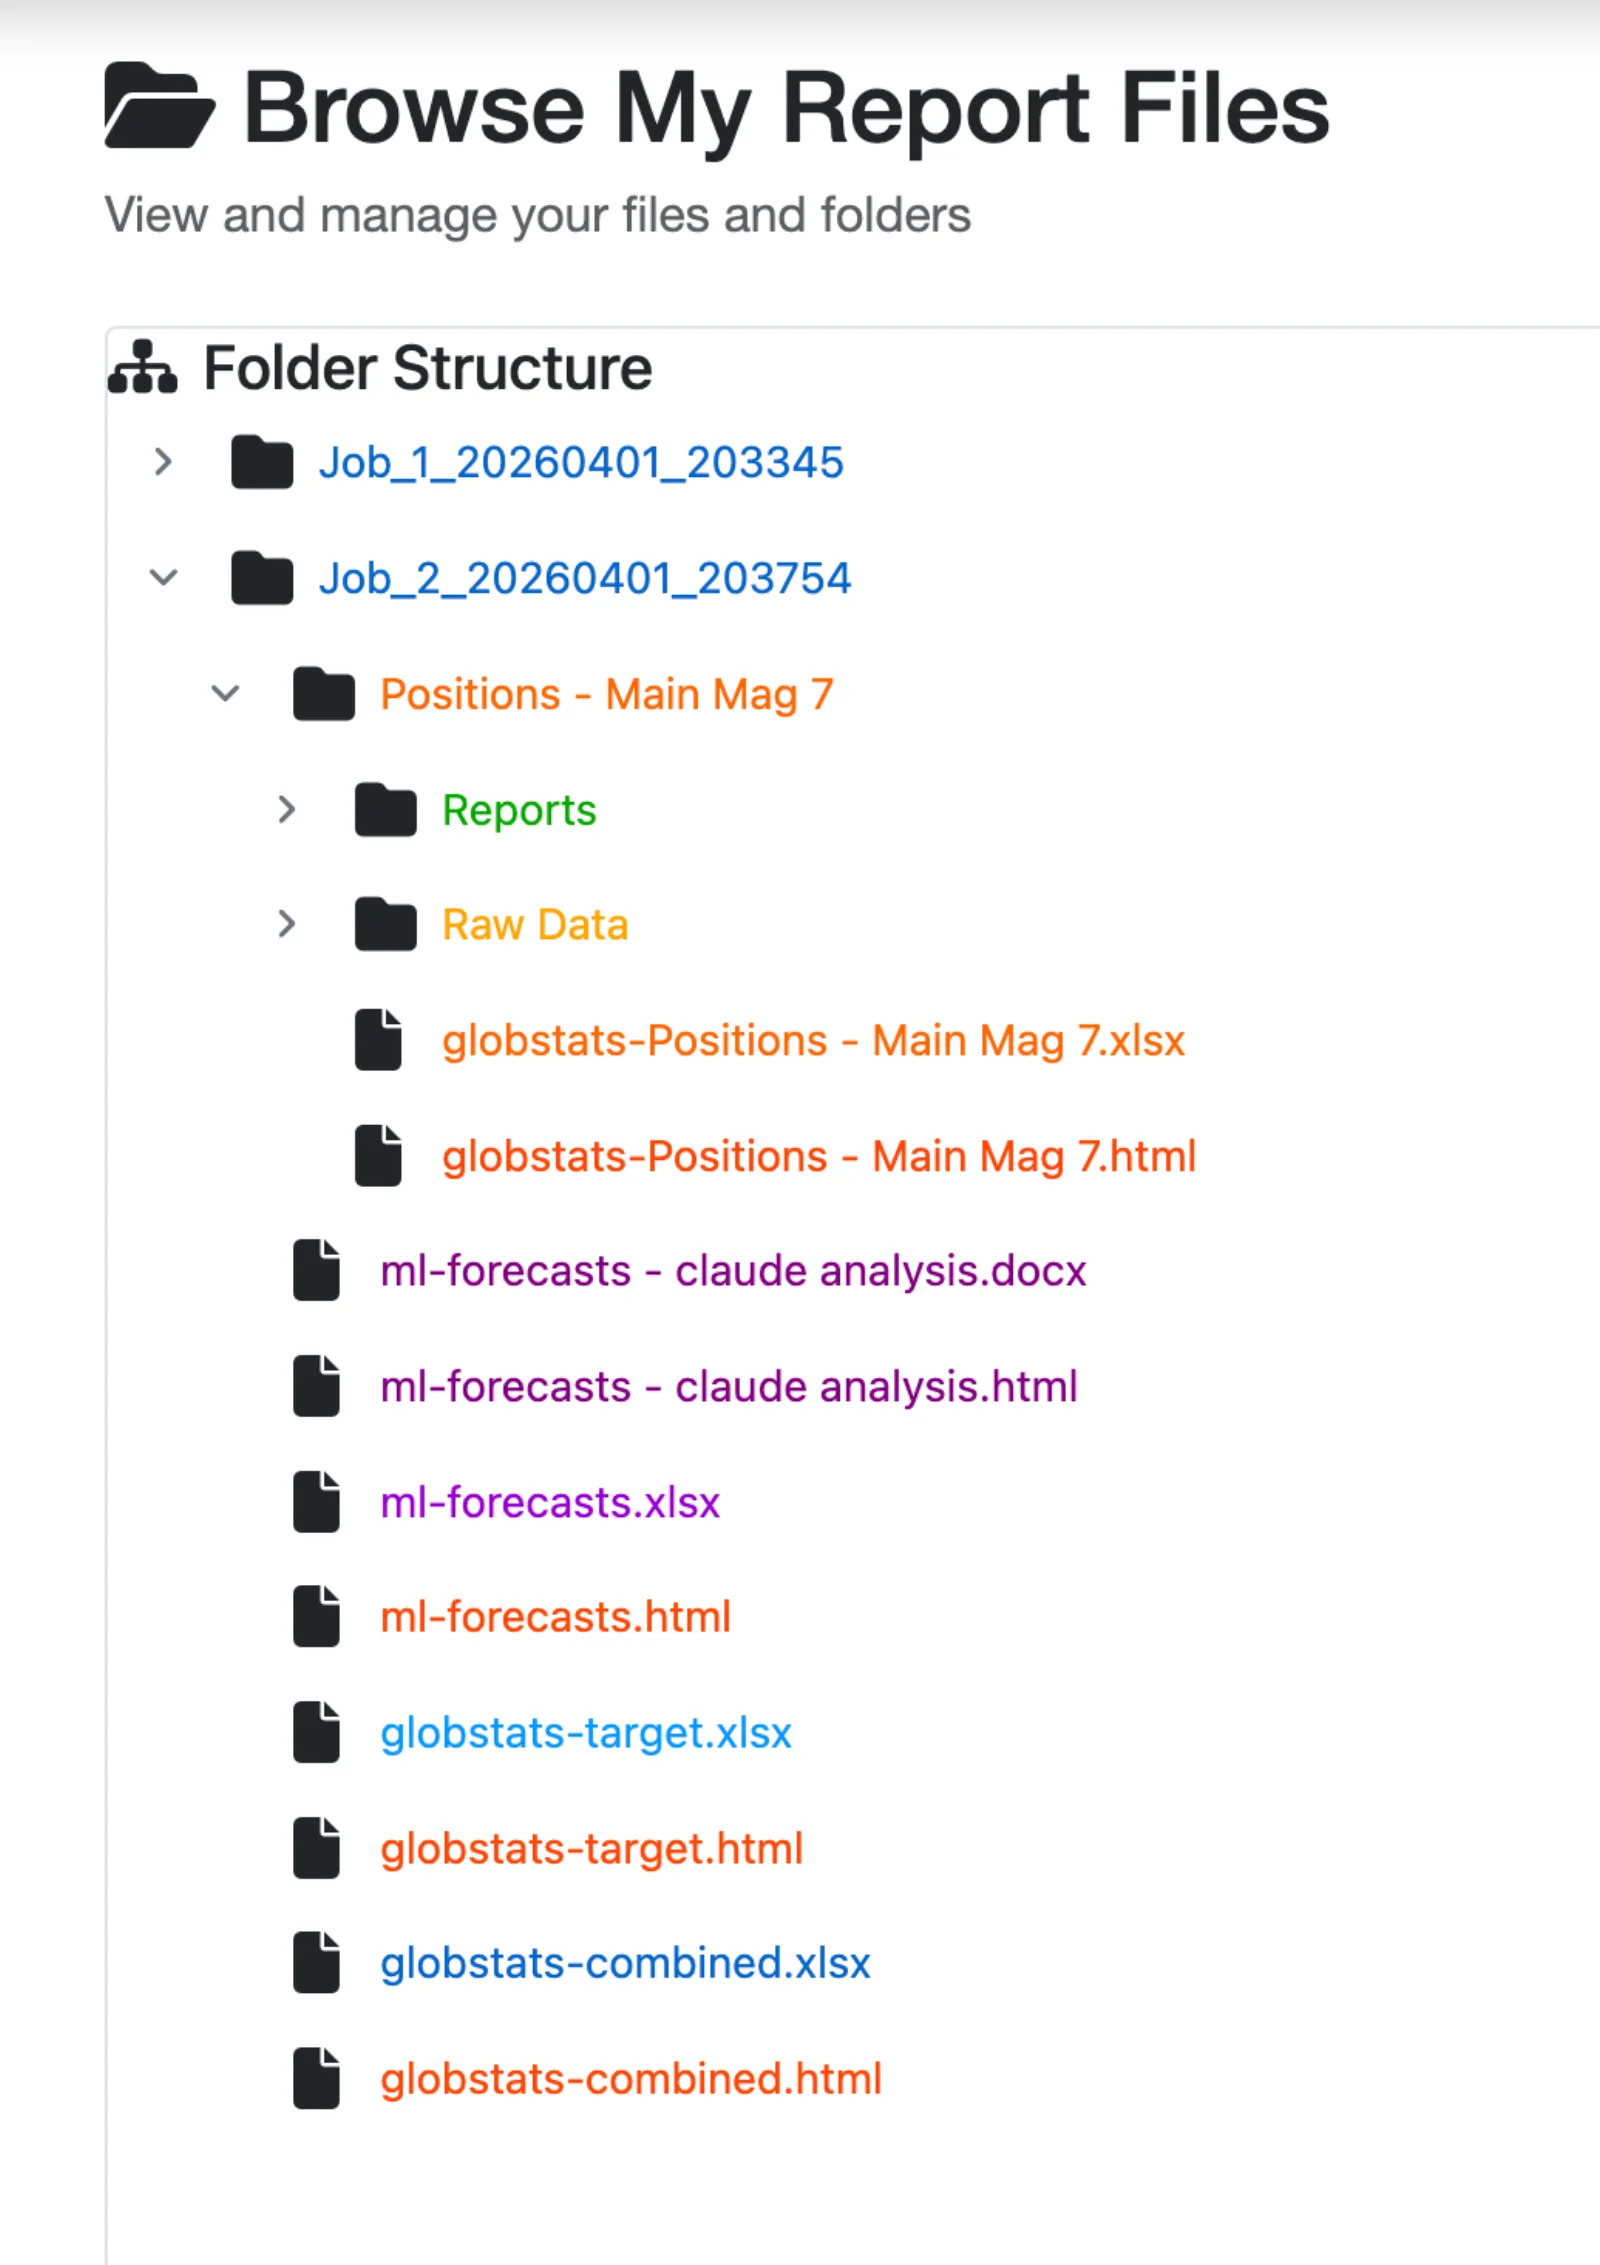
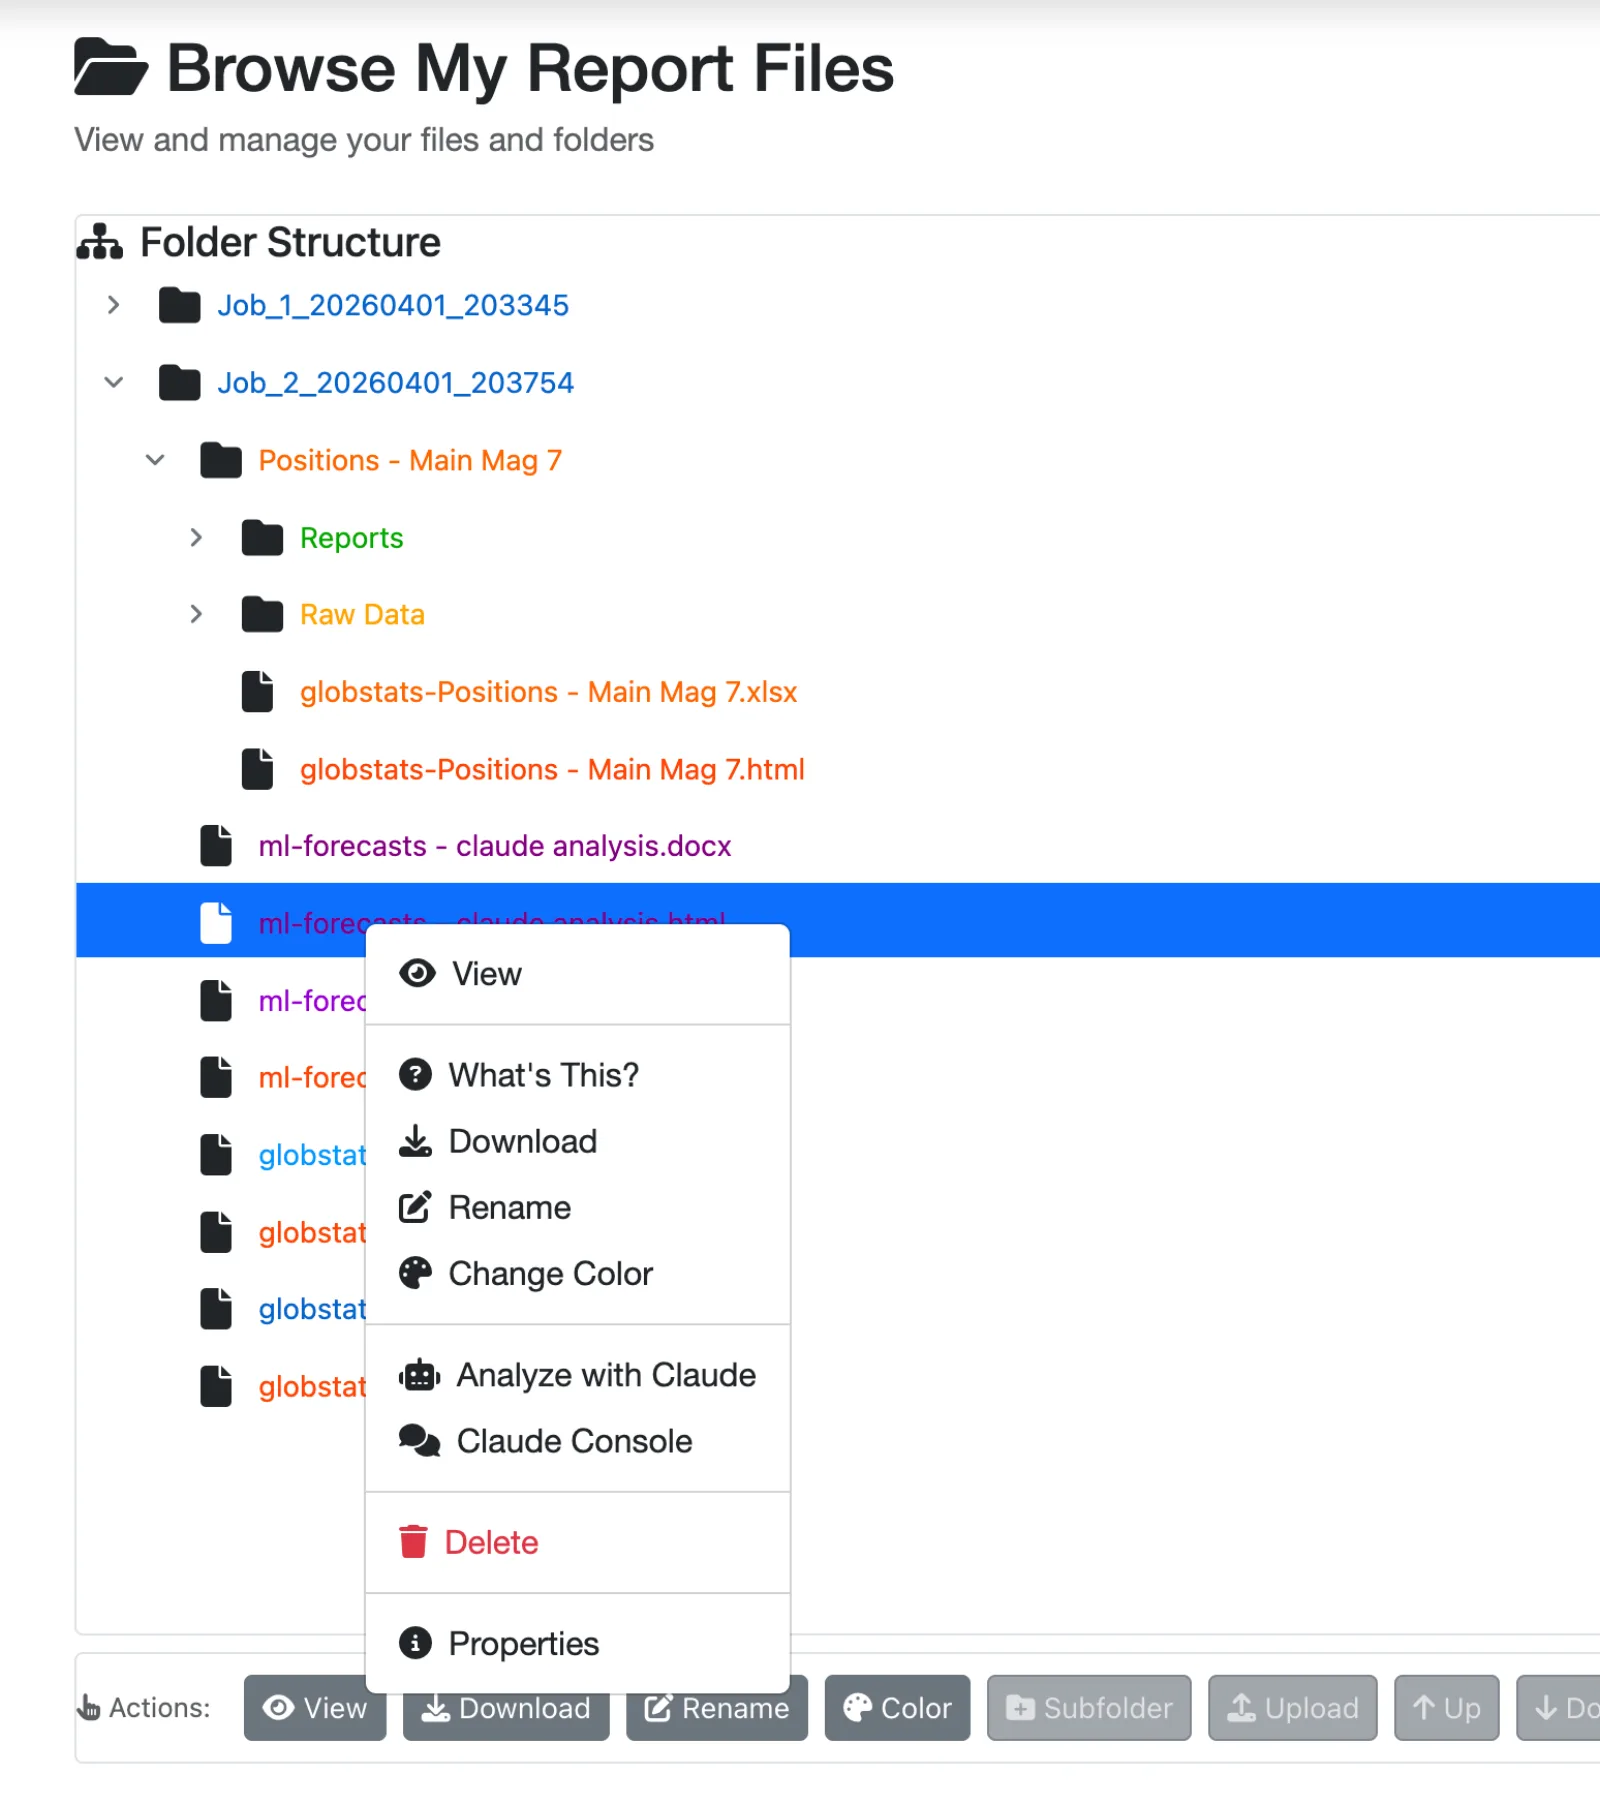
One report generation, seven Mag-7 stocks, twenty-eight files produced — at a cost of $2.10. Click anything to open the actual file.
Cross-holding views — combined metrics, comparative rankings, and breakdowns across the whole list.
Comprehensive analysis across all 7 holdings — revenue trends, debt ratios, cash flow, equity growth.
Targeted performance metrics with thresholds and benchmarks for each holding.
Symbol-list specific analysis — correlations, sector weighting, and risk exposure across the group.
Quarterly predictions for revenue, debt, cash flow, equity — plus sentiment classification — for every stock in the report.
SSA forecasting · anomaly detection · sentiment classification · 4-quarter confidence intervals.
Every stock gets its own Excel + HTML + JSON. 50+ metrics each.
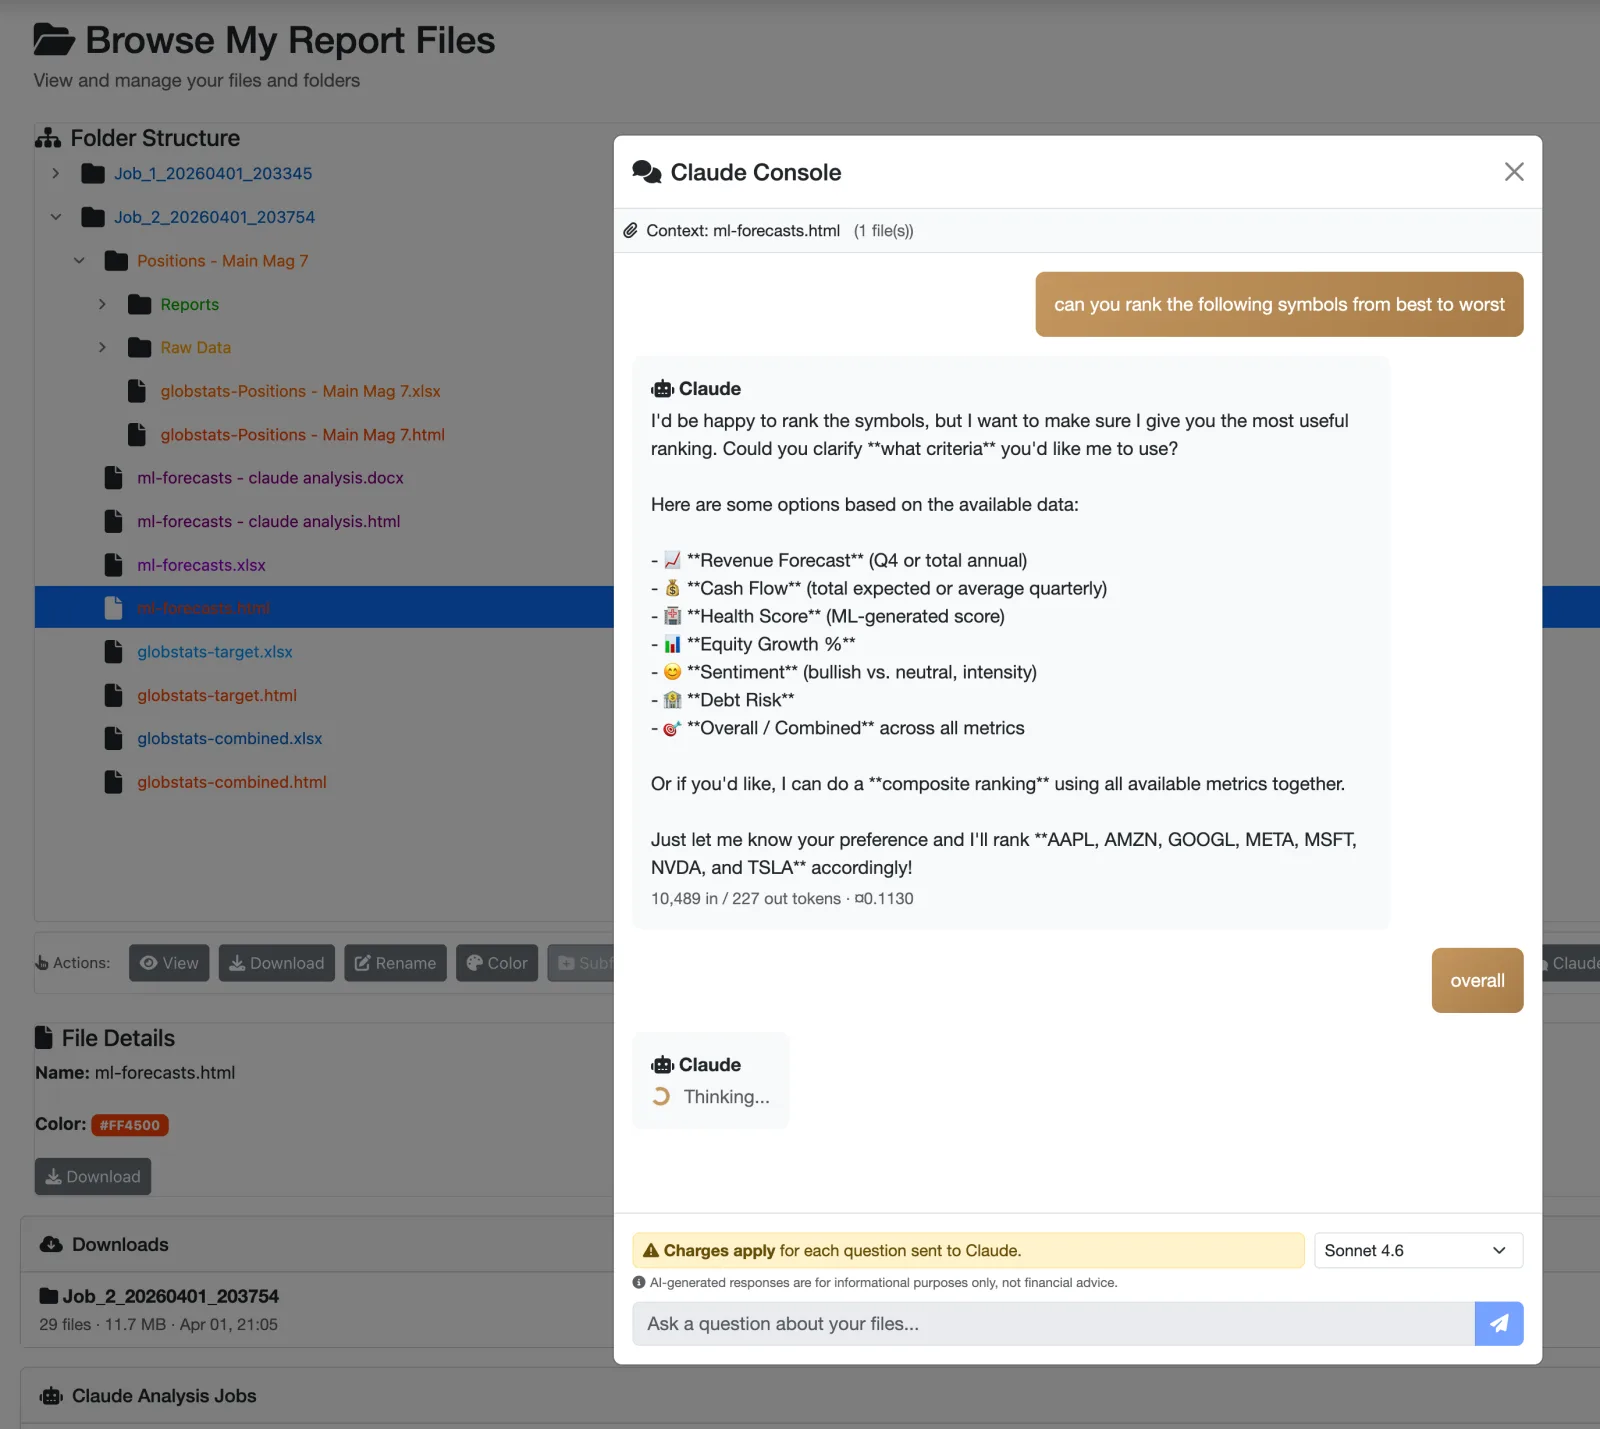
After your reports are generated, right-click any file or folder and send it to Claude. Cost shown before you commit. Every answer comes from your data, not a generic prompt.
Portfolio health summary
Across the Magnificent 7 holdings, the portfolio shows strong aggregate revenue growth of 14.2% YoY with all seven companies reporting positive top-line growth. However, there are notable divergences in financial health:
Strongest performers
Areas requiring attention
Key risk
The portfolio is heavily concentrated in technology with significant AI-related revenue exposure. A slowdown in enterprise AI spending would disproportionately impact NVDA, MSFT, and GOOGL simultaneously.
ML sentiment summary
5 of 7 holdings rated Bullish (AAPL, MSFT, GOOGL, META, NVDA), 1 Neutral (AMZN), 1 Bearish (TSLA).
Estimated cost is shown before you send each question. No surprises.
Multi-tab workbooks with formatted tables, charts-ready data, and conditional formatting. Open in Excel, Sheets, or LibreOffice.
Interactive browser-based reports. View instantly without any software. Share with anyone via a link.
Machine-readable raw data for developers and analysts building their own dashboards or custom analysis.
Sign in free — no credit card required. Track up to 8 stocks with live grades and get one AI report a month, free for life.
Disclaimer: Grade My Investments is not a registered investment advisor and does not provide financial advice. All sample reports, AI-generated grades, scores, and analytics shown on this page are for informational and educational purposes only — not personalized recommendations. AI-generated content may contain errors. Financial data may be delayed. Past performance does not guarantee future results. Use at your own risk. Consult a qualified financial professional before making investment decisions. Full Terms.