A guide · From sign-in to your first report

Four steps.
About five minutes.

No setup wizard. No tutorial video. Sign in with Google, fill out one form, run your first report, and ask Claude about anything that catches your eye. That's the whole flow.

№ 01

Sign in with Google.

≈ 30 seconds

One click. Your Google account becomes your login — no separate password to remember, and we never see it. You'll get the familiar Google consent screen, accept it, and you're back at GMI ready to finish setting up.
№ 02

Set up your account.

≈ 3 minutes

Name, email, and a quick email verification — all on a single form. No payment method needed on the free tier. Submit once and you land on your dashboard. We send a validation link to your inbox; click it and your account is fully active.

№ 03

Run a report.

≈ 2 minutes to generate

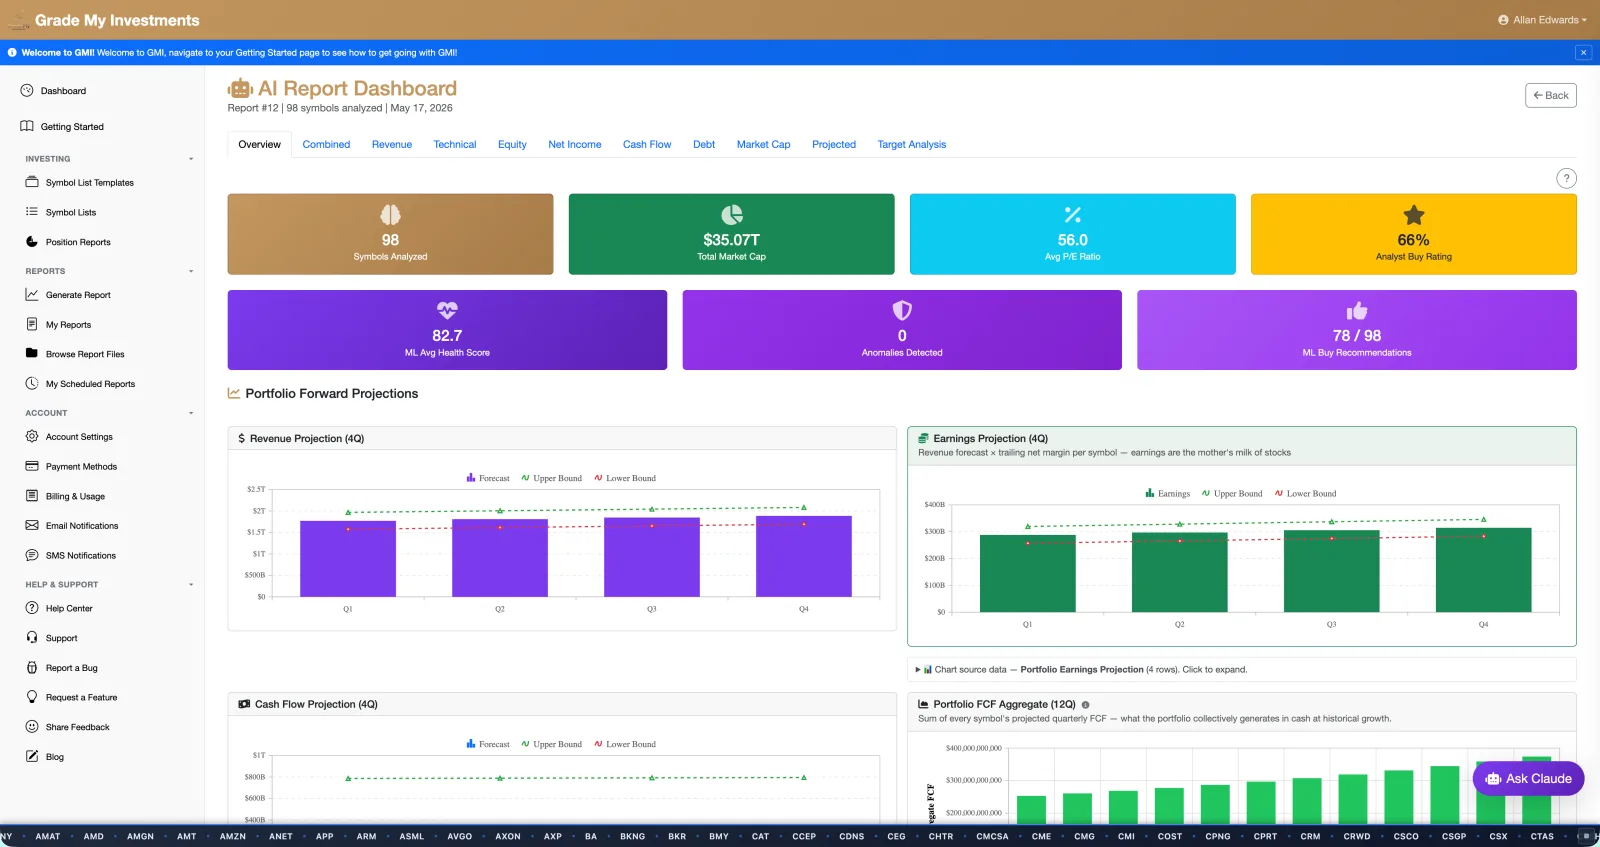
Build a symbol list — your portfolio, an ETF, a watchlist, the Dow 30, whatever you want analyzed. Hit Generate. Two minutes later you have a sortable, filterable dashboard with two grades on every stock, ML forecasts, anomaly detection, and the worst performers surfaced at the top. Download as Excel if you want to take it offline.

grademyinvestments.com / report
GMI Report Dashboard — portfolio analysis with AI grades, ML health scores, forecast charts, and sector breakdown
Your first report — sortable dashboard, two grades per stock, ML forecasts, and a sector quality breakdown.
№ 04

Ask Claude.

Answers in seconds

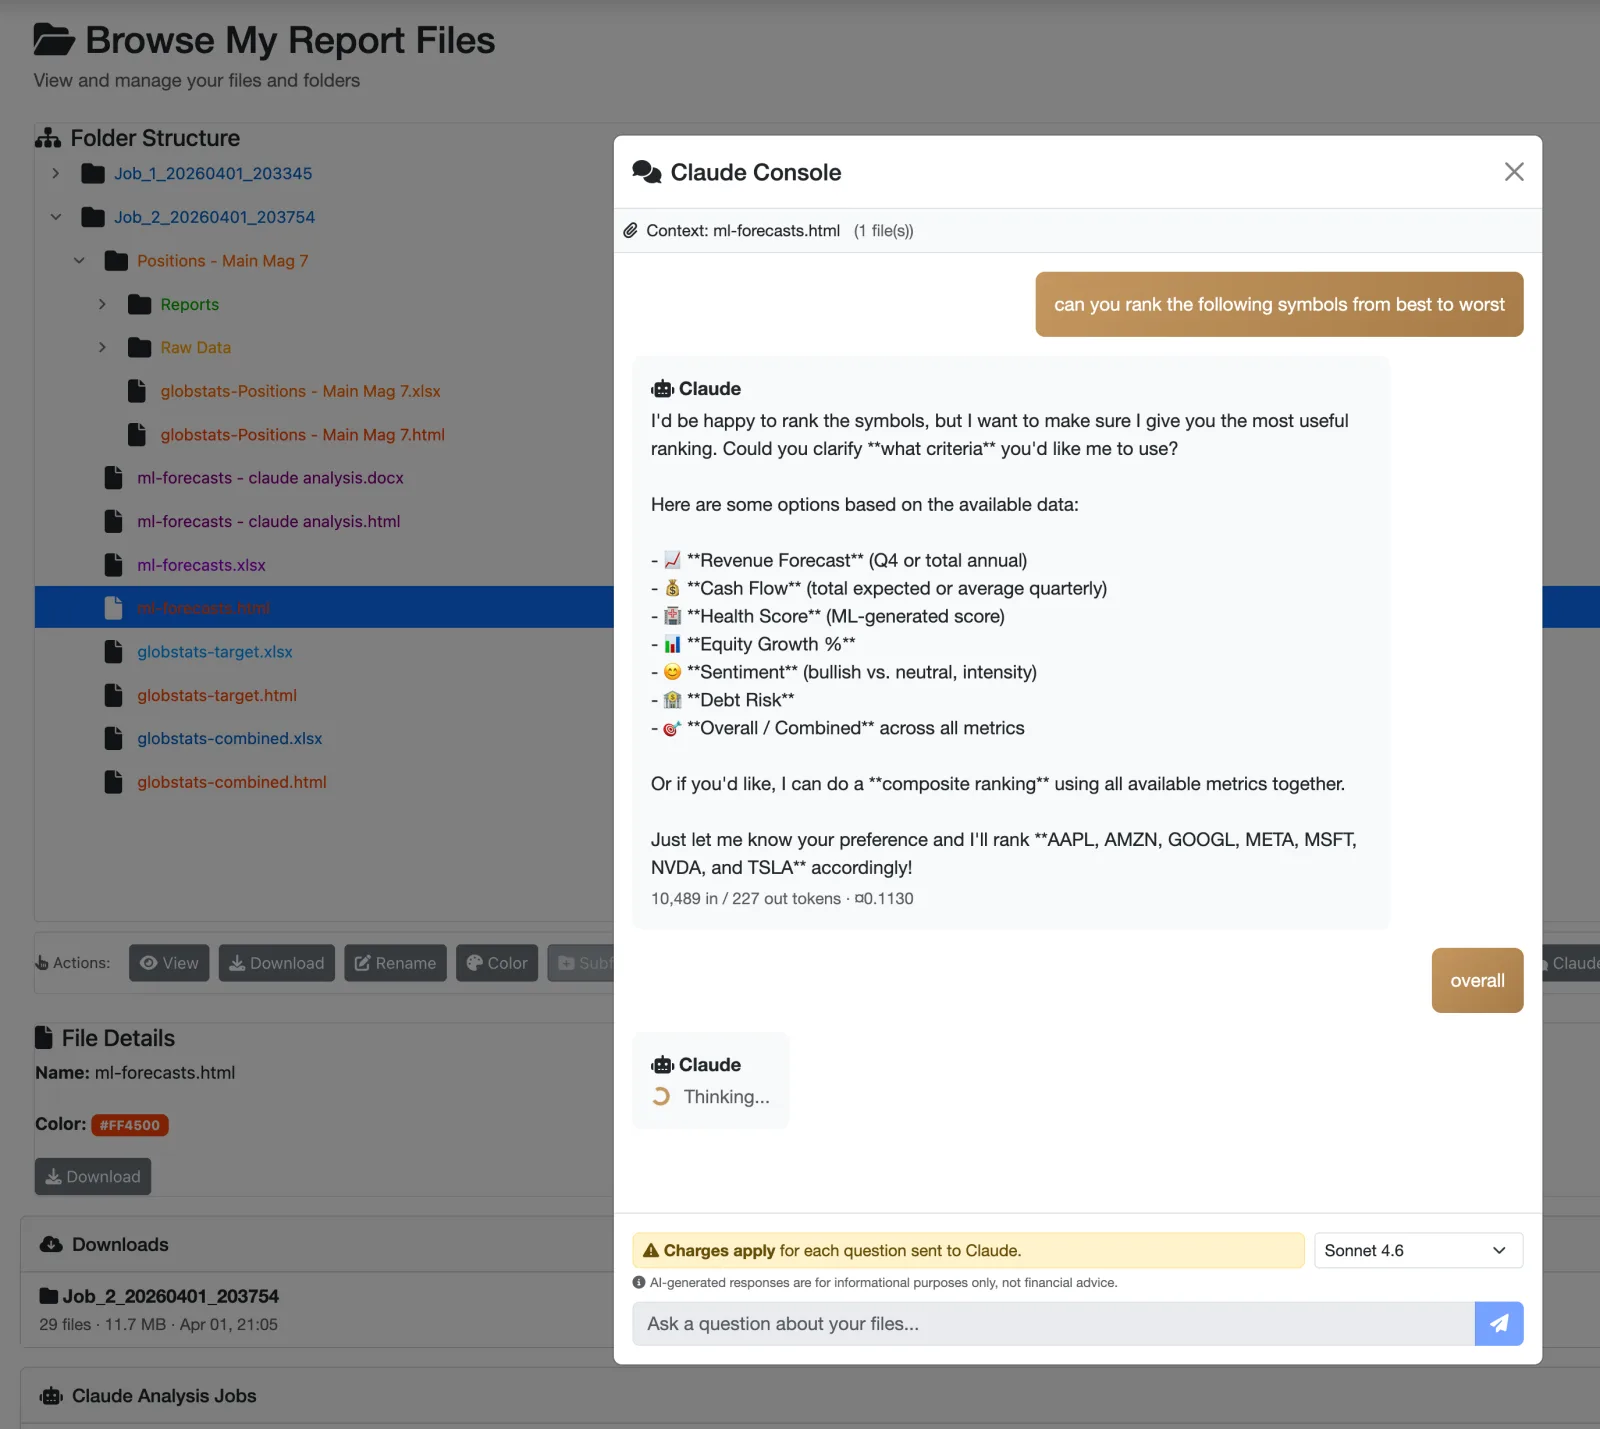
Open any folder of reports and launch the Claude Console. Type a question in plain English — "Rank these by cash flow strength", "Which names have deteriorating debt?", "What changed since last quarter?" Claude reads your actual report data, not a fresh prompt with no context. No hallucinated numbers, no generic essays.

grademyinvestments.com / files · Claude Console
Claude Console — a real conversation about ranking the Mag-7 stocks by financial criteria
The Claude Console, mid-conversation. Cost shown before every query — no surprise token bills.
№ 05

Check the economic weather.

One glance, updated automatically

Your stocks have grades — and so does the economy they swim in. The Macro Dashboard reads 38 official government data series and answers two questions in one glance: which of four economic seasons we're in, and how favorable conditions like these have historically been, as a letter grade calibrated against 29 years of history. Drill from the headline all the way down to every underlying number, see what has historically worked in seasons like this one, and share a pinned snapshot with anyone. It refreshes itself on the government's own release schedule — included with every account, free tier included.

grademyinvestments.com / macro · The Economy, Graded
The Macro Dashboard — current economic regime, macro letter grade, outlook, and upcoming data releases
The Macro Dashboard — the regime, the grade, the outlook, and what data lands next. Take the full tour →
Your first five minutes
0:30
Sign in with Google
3:00
Set up account & verify
2:00
Generate first report
Yours
Review & ask Claude, as long as you like

Total: ≈ 5 minutes from never-heard-of-GMI to your first portfolio analysis. Free to start — no credit card required.

Begin

Ready to start the clock?

Sign in with Google. Your first eight stocks are graded free — no credit card required.

Disclaimer: Grade My Investments is not a registered investment advisor and does not provide financial advice. All reports and AI-generated analytics are for informational and educational purposes only — not personalized recommendations. AI content may contain errors. Use at your own risk. Full Terms.